
Underpricing a commercial cleaning contract costs an operator margin on every hour of a multi-year term, and the mistake usually surfaces around month four. It happens when the price comes from a competitor's rate card, a memory of the walkthrough, or a round number that felt right at the time. A cleaning bid calculator closes that gap by forcing every input — square footage, production rate, burdened wage, overhead, margin — into a cell you can argue with before you sign.
I've underpriced contracts. Every owner who's been at this long enough has, and anyone claiming otherwise is rounding up their memories. The pain doesn't arrive in week one. It shows up around month four, when the account you were proud of winning has quietly been paying you to work.
A bid is a hypothesis about how many hours the work takes, and every underpriced contract is one nobody checked. Test it against the proof of service record your crews already leave behind, then rebuild the next number from what you measured instead of what you assumed.
What does a cleaning bid calculator include?
A cleaning bid calculator is a worksheet that converts measurable site facts into a price: cleanable square footage, production rate, visit frequency, base wage, labor burden, supplies and equipment, overhead allocation, and target margin.
Call it a cleaning estimate calculator or a commercial cleaning bid calculator. The arithmetic doesn't care what's on the tab. Eight inputs, and most owners will name six cold and guess at two. Those two decide whether the account's making money.
- Cleanable square footage — not the gross number on the lease. Strip the shafts, the mechanical rooms, the space nobody touches.
- Production rate — square feet one cleaner covers per hour on this floor type. Swings the bid hardest. Most people borrow it.
- Visit frequency — nights per week, and whether scope shifts on any of them. Friday isn't Tuesday.
- Base wage — what you pay in that market now. Not what you paid in 2023.
- Labor burden — payroll taxes, workers' comp, unemployment, benefits. A real percentage on every wage dollar.
- Supplies and equipment — consumables per month, plus the amortized cost of machines that wear out.
- Overhead allocation — the slice of office, insurance, vehicles, and management this account carries.
- Target margin — what you want left. Set it before you've seen the price, not after.
How do I calculate a cleaning bid?
Divide cleanable square footage by your production rate for hours per visit, multiply by visits per month and by your fully burdened wage for monthly labor cost, add supplies and an overhead allocation, then divide that total by one minus your target margin.
That's how to calculate a cleaning bid. The cleaning contract pricing formula runs five steps, and the first four are bookkeeping almost nobody gets wrong. If you'd rather not build the spreadsheet from scratch, ProTeams has a free commercial cleaning cost calculator that runs the same math from your own inputs.
The fifth is where money dies. Dividing by one minus your margin isn't the same as multiplying by one plus it, and the two get swapped by people who should know better. Multiply an $1,800 cost by 1.20 and you've applied a 20% markup, which leaves a 16.7% margin. Divide by 0.80 and you get the 20% you meant. The difference is $90 a month — over a three-year term, on one account, $3,240 handed to the client because you reached for the wrong button.
What does the math look like on a 10,000 square foot office?
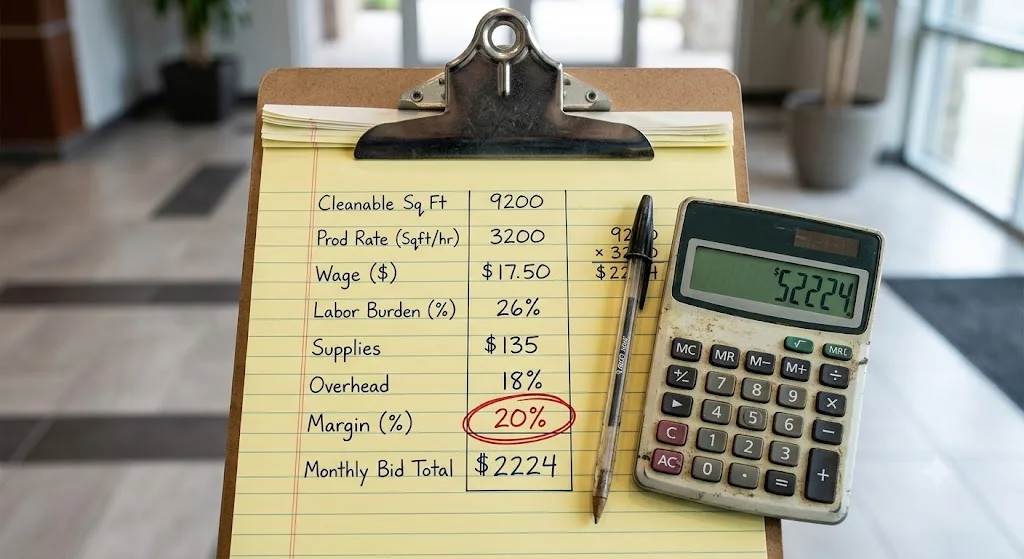
On a 10,000-square-foot office cleaned five nights a week, this model lands near $2,224 a month, and that number is only as trustworthy as the production rate you fed it.
Picture how this plays out. These figures are illustration, not a real account. Swap in your own; the shape holds.
| Input | Value | Runs to |
|---|---|---|
| Gross square footage | 10,000 | — |
| Cleanable square footage | 9,200 | — |
| Production rate (sq ft/hour) | 3,200 | 2.88 hrs per visit |
| Visits per week | 5 | 62.2 hrs/month |
| Base wage | $17.50 | — |
| Labor burden | 26% | $22.05 burdened |
| Monthly labor | — | $1,372 |
| Supplies + equipment | $135 | $1,507 direct cost |
| Overhead allocation | 18% | $271 |
| Total monthly cost | — | $1,779 |
| Target margin | 20% | ÷ 0.80 |
| Monthly bid | — | $2,224 |
Now change one cell. Drop the production rate from 3,200 to 2,625 — the gap between a spec sheet and a tired crew at 9 p.m. Monthly hours climb from 62.2 to 75.9. Labor jumps 22%. Total cost lands at $2,134.
You already quoted $2,224. Your 20% margin is now 4%.
One input, off by 18%. The account still looks fine on the schedule, still passes its walkthroughs.
Why does the production rate break so many bids?
The production rate is the one input that multiplies through every number downstream, so borrowing it instead of measuring it compounds a single bad assumption across every hour of the term.
Published rates describe a good night: new equipment, full crew, a building that behaved. Your Tuesday has a call-out, a conference room that hosted forty people and a caterer, and a machine that's been making that noise since spring.
Turnover resets the rate too. A cleaner who's worked a site two years knows which floor to start on; their replacement won't, for months. If your rate assumes the veteran and your crew is the replacement, the gap shows up in hours you pay for and never priced.
So measure it. Time a real shift on a comparable site with your own people, divide cleanable square footage by the hours it took, and use that. Published janitorial production rates are a starting point, but the rate that prices your contract is the one you measured. Your scheduling and dispatch software already knows which crew was assigned where, so that's where the timing starts.
How do you find out whether the estimate was right?
You compare the hours your bid assumed against what the site record shows — when the crew checked in, when the service got marked complete — and you do it while there's still room to renegotiate.
The raw material's usually sitting there. A check-in carries a timestamp. Service completion carries one. Proof of Service photos come back flagged verified when captured on-site, unverified when uploaded off-site. On Growth and Scale the check-in is geofenced against a boundary you drew; on Launch it's geo-tagged; on Freemium neither. The mechanics are laid out in GPS proof of service explained.
ProTeams doesn't calculate your labor hours. No labor cost, no per-account profitability, no custom report builder waiting to assemble one. I'd rather you hear that from me than discover it in month three. Its KPIs answer whether work is happening and who's dependable. Bid math stays in your spreadsheet.
What you get's the raw fact of what happened. Two timestamps and a photo. You do the subtraction yourself, early.
Frequently Asked Questions
How do I calculate a cleaning bid?
Divide cleanable square footage by your production rate for hours per visit. Multiply by visits per month and by your fully burdened wage for monthly labor cost. Add supplies and an overhead allocation, then divide that total by one minus your target margin.
What does a cleaning bid calculator include?
Eight inputs: cleanable square footage, production rate, visit frequency, base wage, labor burden, supplies and equipment, overhead allocation, and target margin. Anything fewer and you're hiding a cost somewhere, usually burden or overhead.
What production rate should I use for an office building?
Your own, measured on your own floors. Time a real shift on a comparable site, divide cleanable square footage by the hours it took, and use that. A borrowed rate describes somebody else's crew on somebody else's building.
Should I price a bid against a competitor's rate card?
No. A competitor's price tells you what they charge, not what the work costs you. If their production rate beats yours, matching their price means signing up to lose money at a pace you won't notice for a quarter.
Can ProTeams tell me whether I underpriced an account?
Not on its own. ProTeams records when a cleaner checked in and when the service was marked complete, so the raw record's there. It doesn't calculate labor hours, labor cost, or per-account profitability, and there's no custom report builder. The arithmetic stays in your spreadsheet.
The number you can defend
A calculator won't make you brave. You'll still sit across from a property manager who calls your price high, and still feel the pull to shave it. What changes is you'll know what you're shaving, and you'll have the sentence that ends those conversations: at that price, here's the hour I take out of your building.
Month four's a terrible time to learn arithmetic. Build the sheet before the walkthrough.
Know what the job actually costs you
You can build the sharpest bid calculator in your market and still bleed an account, because the estimate is only half the equation. The other half is what happens on site after the ink dries.
ProTeams.io helps commercial cleaning companies centralize the systems that keep field operations moving:
- Crew scheduling and shift check-ins
- Field communication between office staff, supervisors, and cleaners
- Issue tracking and service requests
- Attendance visibility and field accountability
- Checklists and task completion follow-up
- Operational reporting across clients and locations
Start with a real record of the work, and next year's bid has something behind it.