
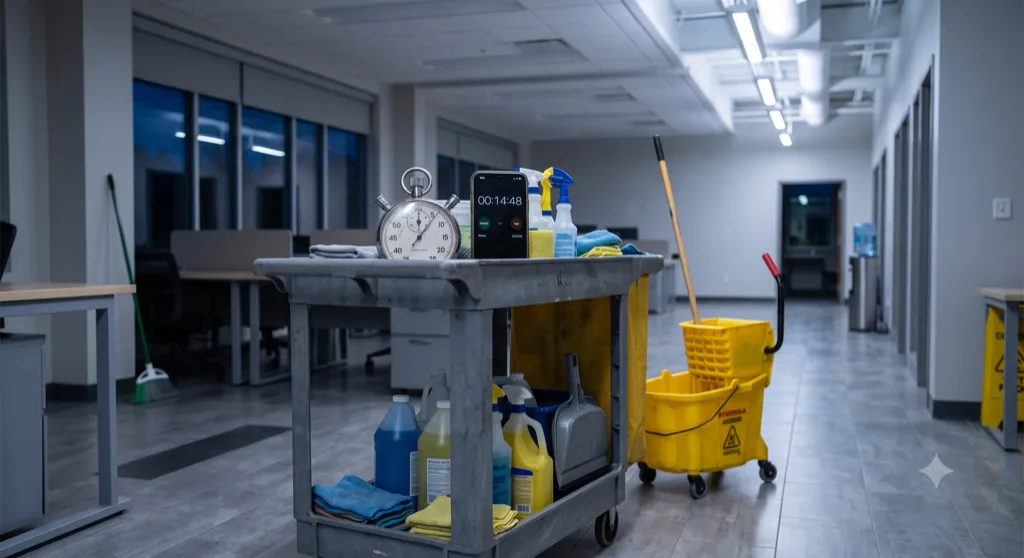
Borrowing published janitorial production rates costs commercial cleaning operators real money at bid time. Industry guides like ISSA Cleaning Times are built on averaged, controlled-condition studies—they're benchmarks, not site-specific blueprints. When actual site conditions don't match the assumptions baked into those averages, hours run over, margins erode, and the shortfall comes out of your pocket. The fix is measuring your own rates on your own accounts before the next bid.
I run operations at Verdant Building Service in Texas, and I remember the first time I really understood this lesson. We'd bid three office buildings off a standard ISSA rate sheet—felt confident, everything looked clean on paper. Six weeks in, all three were running 20 to 30 percent over on labor hours. Not because our crews were slow. Because the published rates assumed conditions those buildings never had: open floor plans, minimal transitions, consistent soil levels. What we actually had were dense cubicle grids, heavy foot-traffic restrooms, and a building two where the janitorial closet was on the wrong end of the floor for half the scope.
That's when we stopped borrowing rates and started measuring our own. If you're still copying numbers out of a guide and plugging them into bids, this post is for you. It walks through how to calculate your own production rate and what to do with that data once you have it. We also use janitorial production rates as a living input—something we revisit account by account—not a number we set once and forget.
The short version: Published production rates are averages. Your buildings aren't average. Measure your own rates on your own accounts and your bids will reflect what your crews actually do.
This post covers why the gap exists, how to run a simple times study, and how to track the data you already have using shift completion records from your field team.
What Are Janitorial Production Rates—and Where Do Published Numbers Come From?
A janitorial production rate measures how much area one cleaner can service per hour on a specific task, expressed in square feet per hour or minutes per fixture. When you see a number like "3,289 square feet per hour" cited as an industry average, it's typically sourced from ISSA's cleaning times guides—studies that aggregate times across multiple cleaners performing the same task under documented conditions.
ISSA's 612 Cleaning Times is the most-referenced standard in North America. The methodology is real: multiple trained cleaners, the same task, the same supplies, averaged and adjusted for breaks and transitions. That's legitimate time-motion work. The problem isn't the process—it's the word "average." Averages flatten the variance that kills bids. A general office area might clean at 4,200 square feet per hour in a wide-open floor plan with low furniture density. That same task in a dense cubicle environment with heavy pedestrian traffic might run closer to 2,800. Same task. Very different result.
ISSA itself is clear about this. Its own guidance says the published rates "are meant to be used as a benchmark to compare your organization to an industry standard"—not as a direct substitute for measuring your own buildings. Operators who treat them as a direct input into bids are using a tool outside its designed purpose.
Why Do Published Rates Miss the Mark on Your Accounts?
Published benchmarks assume conditions that most real commercial accounts don't consistently deliver—and the gap between the assumed condition and the actual one is where your labor overrun lives.
There are at least five variables that move production rates site by site, none of which a table can capture:
- Floor type and mix. Carpet vacuums faster than tile mops. A building that's 60% carpet and 40% VCT cleans on a different clock than one that's the reverse—even at identical square footage.
- Furniture density and obstruction. Open space cleans fast. Dense workstations, chairs, under-desk cords, and tight aisle widths slow everything down. The rate sheet doesn't know your client rearranged the floor in Q2.
- Soil level. A low-traffic executive suite and a high-traffic call center are not the same cleaning task. Published averages assume a standard soil condition that may not match your SOW.
- Transition time. The minutes your crew spends moving between floors, waiting for elevators, repositioning carts, and unlocking rooms are real labor hours. They don't appear in a task-level time study. They appear on your invoice.
- Restroom fixture count vs. square footage. Restrooms are measured in fixtures, not square feet—toilet, sink, urinal, each a separate task. A building with 14 restrooms and 4 fixtures each cleans very differently from one with 7 restrooms and 8 fixtures, even at the same overall square footage.
Add scope-of-work drift—clients who add tasks informally, areas that expand without a contract amendment—and the published rate becomes even less representative over time. You signed on one building. Six months later you're cleaning a different one.
How to Calculate Your Own Cleaning Production Rate
The formula for your own production rate is simple: divide cleanable square footage by the hours worked on that site during a measured period, then average across multiple visits.
Here's the method, broken down:
- Choose one task and one site. Start with something repeatable—vacuuming, restroom turnovers, or floor mopping. Pick a site where you have a consistent crew and a reliable square footage figure for that area.
- Measure the cleanable square footage. Not gross square footage. Cleanable square footage—the area your crew actually services, excluding storage rooms, mechanical spaces, and areas not in scope.
- Clock the actual task time. Your supervisor or a crew lead logs start and finish for that specific task on that site, across at least three visits. Not total shift time—task time. Note conditions each visit: soil level, any obstructions, any changes to the space.
- Calculate and average. Hours worked ÷ cleanable square footage = your production rate for that task at that building. Average the three-plus data points. That's your baseline.
- Repeat by building type. A corporate office, a medical clinic, and a light-industrial facility will have distinct baselines. Don't mix them into a single number.
Picture how this plays out: a crew vacuums a 12,000 square foot office in 3.1 hours across four measured visits, averaging 3,870 square feet per hour. The ISSA benchmark for that task is 4,200. The actual difference—330 square feet per hour—translates to roughly 25 extra minutes per visit. On a 5-day-per-week account, that's more than 2 additional labor hours per week you didn't account for in your bid. Multiply that across three accounts and you're already over on a part-time position.
How Does Scheduling and Dispatch Software Fit Into Production Rate Tracking?
The data you need to calculate your own production rates already exists in your operations—the question is whether you're capturing it in a form you can actually use.
When your crew checks in at the start of a shift and the system logs a service-completion timestamp at the end, you have the raw inputs: time on-site, tied to a specific location. That's hours worked. You supply the cleanable square footage for that account. Divide one by the other and you've got a real production rate for that building—measured from your own crew's actual performance, not borrowed from a guide.
At Verdant, we use ProTeams for scheduling and dispatch software, and one of the things I've started doing is cross-referencing shift completion data with our bid estimates for accounts we've held for more than 90 days. The timestamps don't lie. If we bid a site at 3.5 hours and the completion record consistently shows 4.2, I want to know that before the renewal conversation—not during it.
ProTeams' Proof of Service feature also gives us time-stamped photo documentation at the task level, which layers in another data point: when specific tasks are getting done, and whether they're being completed on-site versus logged off-site. That's useful for understanding where in the shift the time is actually going—not just the total clock, but the shape of the work inside it. On Growth and Scale plans, geofenced check-in confirms on-site presence at the moment the clock starts, so the timestamp you're using to calculate rate is clean rather than estimated.
None of that computes the production rate for you. You're still exporting the data and doing the division. But having timestamps that are accurate and tied to specific locations makes the measurement step something you can actually do consistently, across your whole portfolio, without clipboard observers following crews around on every shift.
What to Do With Your Own Production Rate Data
Once you have building-specific production rates, they become the foundation of every bid, renewal, and staffing decision you make on those account types.
First: build a simple internal rate sheet by building category. Corporate office, medical, industrial, retail—each gets its own baseline. When you bid a new building of a type you've measured, you're not guessing. You're applying a rate your crews have actually demonstrated on a comparable site. That's a very different confidence level than borrowing a number from a trade guide.
Second: use the rates to diagnose accounts that are running over. If a building has consistently higher hours than your model predicts, the rate comparison tells you what to look at. Is the cleanable square footage accurate? Has the scope drifted? Is there a transition-time problem you haven't quantified? You can't answer any of those questions with a published rate. You can answer them with your own measured baseline because you know what it was built on.
Third: update rates when conditions change. New equipment, crew turnover, a scope expansion, a building renovation—each of those shifts the baseline. Don't let old data drive new bids. For stable accounts with consistent crews, an annual review is usually enough. For new accounts, measure within the first 60 days—before you've committed to a renewal price.
Internal rate data is also a differentiator in competitive bids. If you can walk into a renewal conversation and show a client that your bid reflects actual measured hours on their specific building—not an industry average applied to their square footage—you're having a different conversation than every other contractor in the room. Most of your competitors are still borrowing numbers. You don't have to.
You can read more about how cleaning contract pricing connects to production data—the rate is one input, but it's the most accurate input you can have.
Frequently Asked Questions
How do I calculate my own janitorial production rate?
Clock your crew on a specific task—vacuuming, mopping, restroom turnovers—on one of your actual sites. Record the time in minutes, then divide the cleanable square footage by the hours worked. Do it across at least three visits on that site, then average the results. That's your baseline for that building type and scope. Repeat for each distinct building category in your portfolio, because a medical office runs very differently from a corporate lobby.
What is a good production rate for office cleaning?
Industry benchmarks from ISSA put general office areas around 3,000–4,200 square feet per hour for a trained cleaner under standard conditions. Restrooms drop sharply—closer to 1,000 square feet per hour because you're working fixture by fixture. What's "good" for your operation depends on your actual site conditions: furniture density, floor mix, soil level, and how many transition minutes your crew loses between spaces. Published averages are a starting point, not a target.
Are ISSA production rates accurate?
They're accurate as averages—built from time-motion studies across many cleaners and many sites under controlled conditions. The problem isn't the methodology; it's the assumptions baked in. ISSA rates assume optimal soil levels, ideal floor layout, correct equipment, and no excessive transition time. Most commercial sites don't match all of those conditions at once. ISSA itself recommends using its rates as a benchmark to compare against, not as a substitute for measuring your own buildings.
Why do my crews consistently run over the hours I estimated?
Usually it's one of three things: your bid assumed a production rate your crew can't hit on that specific site, the scope of work changed after you signed (more fixtures, heavier soil, added areas), or you're losing uncounted time to transitions—elevator waits, cart moves, locked-room delays. None of those show up in a published rate table. They only show up when you measure actual hours against actual square footage on your own accounts.
How often should I update my production rate data?
Revisit your rates when something changes: new equipment, a crew turnover that shifts your average skill level, a scope expansion on an existing account, or any time a building starts running over hours. For stable accounts with steady crews, an annual review is usually enough. For new accounts or new building types, measure early—within the first 60 days—before you've committed to a renewal price.
Stop Bidding Off Someone Else's Numbers
Every hour your crews run over your estimate is money you bid away. When the rate you used doesn't reflect what your crews actually do on your actual buildings, the shortfall is yours to absorb—not the client's.
ProTeams.io helps commercial cleaning companies centralize the systems that keep field operations moving:
- Crew scheduling and shift check-ins
- Field communication between office staff, supervisors, and cleaners
- Issue tracking and service requests
- Attendance visibility and field accountability
- Checklists and task completion follow-up
- Operational reporting across clients and locations
The timestamps are already in your operations. Put them to work before your next bid.